Introduction
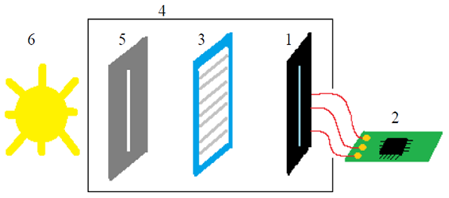
The concept of the hardware bloc of the designed spectrometer developed in the scope of the PULSE-COM project is shown on the Figure 1 below. It includes a Linear Charge Coupled Device (CCD) image sensor, a TCD1304AP/Toshiba, assembled in a custom DIP package which has 3648 effective pixels, a 32-bit microcontroller/STMicroelectronics, selected from the STM32F103 family to interface with the CCD image sensor, and a custom 3D printed inhouse enclosure to precisely encapsulate the main instrument parts. In addition to the diffraction grating, which is used to separate the beam of light into individual wavelengths.

Figure 1: Bloc diagram of the spectrometer. 1- Image Sensor, 2- Image processing unit, 3- Diffraction grating, 4- Enclosure, 5- Slit for the incident light, 6- Light source.
Diffraction grating
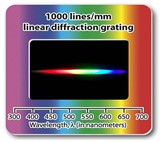
Within the PULSE-COM project, one of the SITEX 45 objectives was to ensure a spectral resolution of 10 nm in its optical network. The results obtained when a plastic film diffraction grating is used are presented hereafter. Four alternative solutions have been considered. The light passing through the grating is diffracted (Figure 2), and separated into different colours, based on their specific wavelengths.

Figure 2: Illustration of the separation of light in colours of wavelengths.
Operation details
The light that passes through the pinhole is decomposed on the diffraction grating. The image of the diffraction pattern is captured by the CMOS camera. The setup resolution for these captures is 640 x 320 pixels. The captured image is analysed by the image processing algorithms, implemented in the custom-developed software. The output of this analysis will plot the spectrum of the light source.
The calibration process of the spectrometer is done with an RGB LED, which defines an active area of 400 pixels from the 640 pixels available on the captured images. In this manner, the 400 pixels will correspond to the 380-750 nm visible spectrum, which ensure a resolution for the spectrometer close to 1 nm/pixel.
The experimental measurement
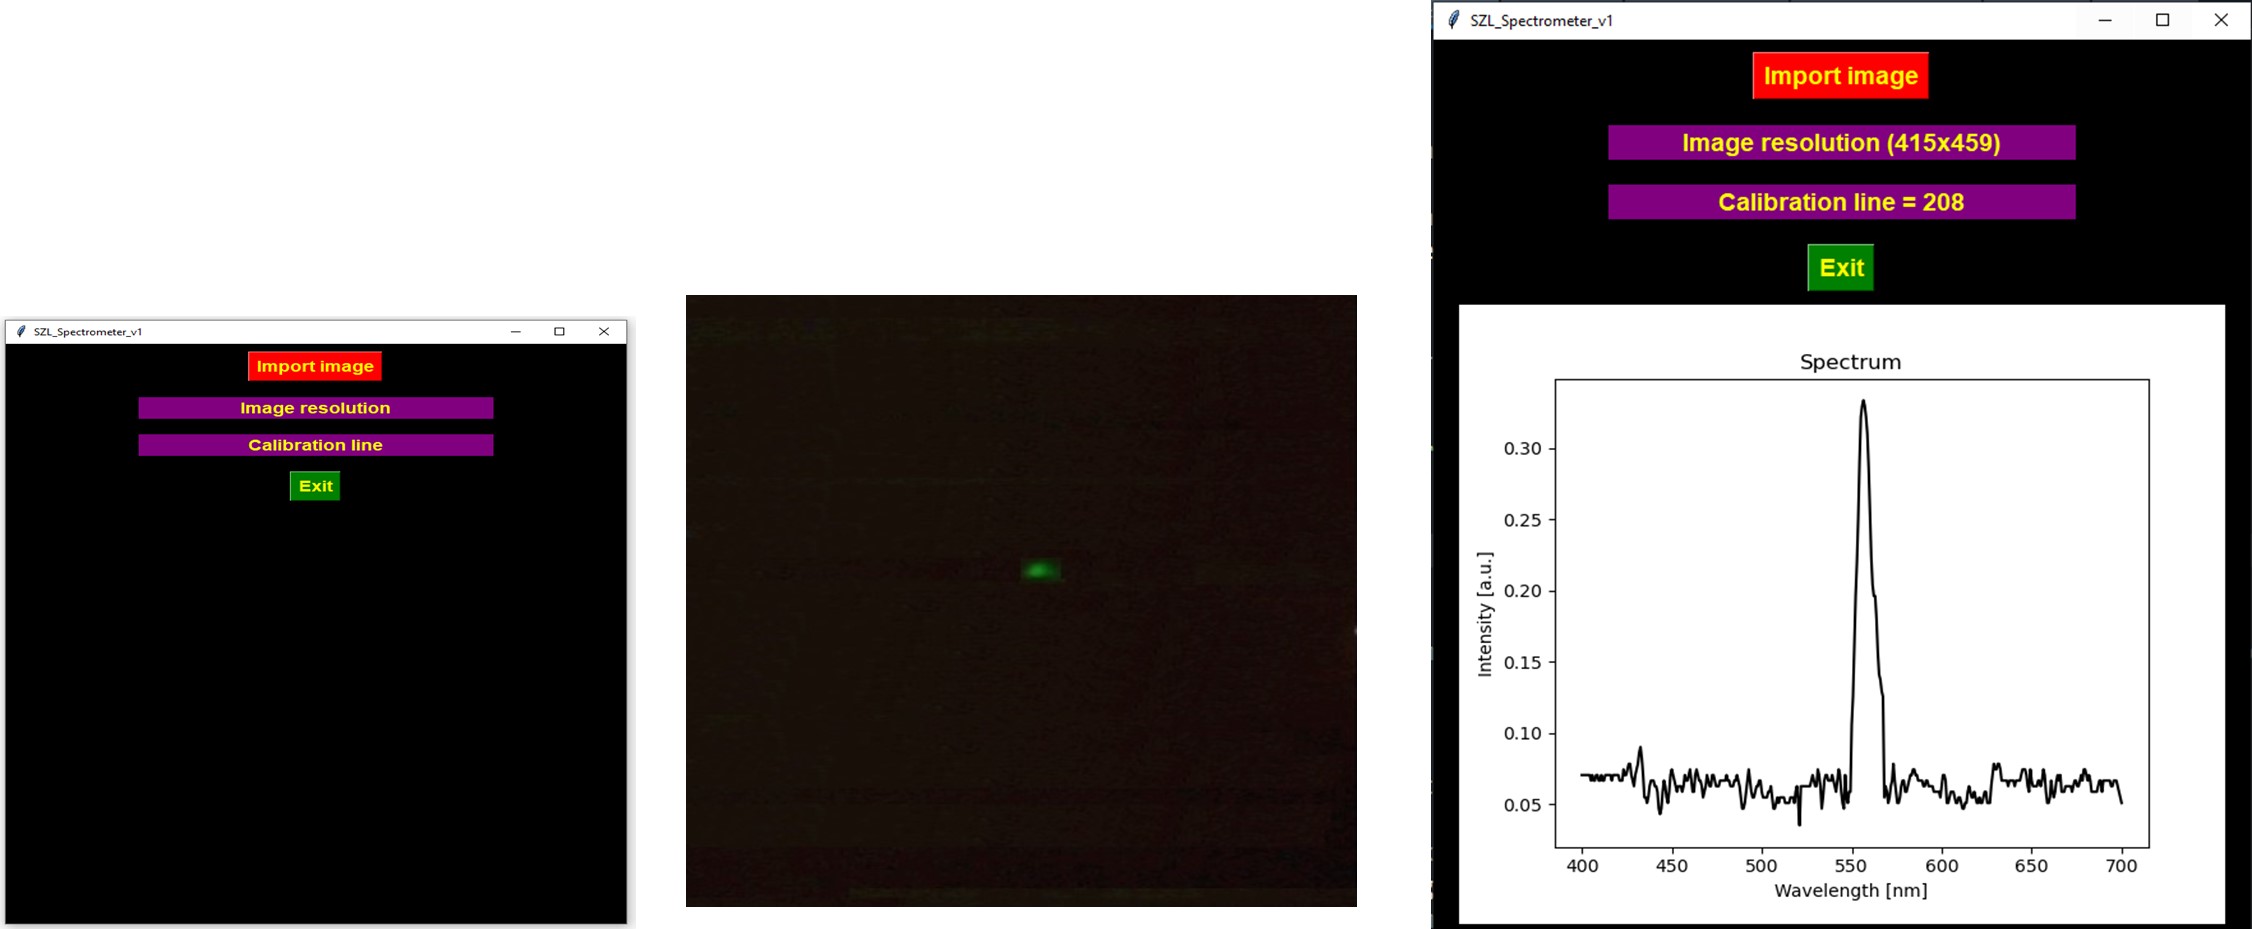
Spectral diagrams have been obtained for various LED’s sources. The results for the Green LED device are presented hereafter as an example. It has been found that 459 pixels for emission spectrum analysis corresponds to the bandwidth of 300 nm (400-700 nm) means 1.5 pixels/nm.
It confirms the spectral resolution of SITEX 45 spectrometer instrument developed on the visible domain (400-700 nm) is of 1 nm, far under 10 nm requested within the project.

Figure 3: Left, Main interface; Middle, The image under analysis for G-LED spectrum diagram; Right: The spectrum diagram displayed for the Green LED.


